What’s covered:
- Creating multi-language reports and its challenges
- A more streamlined and hands-off approach with Gridly and Python
- Step-by-step guide to create and automate multi-language reports
- Conclusion
In today’s globalized business environment, creating reports that cater to diverse, multilingual teams isn’t just a luxury—it’s a necessity. However, managing multi-language reports often involves a complex web of translation files, spreadsheets, and manual processes that can drain both time and resources. Whether you’re a data analyst juggling weekly reports for international stakeholders or a developer seeking to streamline your multilingual documentation workflow, the challenge of maintaining accuracy and consistency across multiple languages remains constant.
This comprehensive guide will walk you through a modern, automated approach to creating Python multi-language reports that eliminates these common pain points. By combining the power of Python’s data processing capabilities with Gridly’s localization features, you’ll learn how to build a robust system that handles everything from data extraction to automated translation and distribution. Say goodbye to manual translation management and hello to a more efficient, scalable way of creating multilingual reports.
Creating multi-language reports and its challenges
Multi-language reports are essential for international companies. They ensure members of a globally diverse team stay in sync. Data analysis teams typically create multi-language reports with the following steps:
- Extract data
- Process data
- Generate visualizations
- Write the report
- Translate report into different languages
- Distribute to communication channels
At step 5, translation commonly involves extracting report content into PO files. With their unique formatting, syntax, and tags, working with PO files can be challenging for those who are unfamiliar.
Additionally, some teams use Google Sheets to store content and Google Translate for handling translations. While this approach sounds simple and intuitive, possible issues include inconsistent translation quality, lack of context, and difficulties in managing updates across multiple languages.
These complexities slow things down and increase potential for errors in multilingual reports.
A more streamlined and hands-off approach with Gridly and Python
In this article, I will demonstrate how to automate the generation of Python multi-language reports with the help of Gridly. The final solution will be a Python script designed to:
- Automatically extract data from databases and external files
- Process the data for metrics
- Generate multi-language HTML reports with interactive visualizations and detailed comments
- Send these reports to stakeholders
The final report will consist of:
- Report title and date
- A bar plot, side-by-side charts, and a table
- A comment area for providing context and insights

Step-by-step guide to create and automate multi-language reports
What you will need
- A basic understanding of Python programming, which has become a powertool for handling and processing data in recent years.
- A Gridly account that you can sign up for free and access all professional features for 14 days without a credit card. This will be used to automate the localization of your report. Learn more about Gridly.
Create and automate multilingual reports
Firstly, clone the repository for this project by opening your terminal or command prompt and running this command.
git clone https://github.com/gridly-spreadsheet-CMS/multi-lang-report-generation.git
1. Extract data
For databases such as AWS Redshift, we ensure secure access by configuring credentials through environment variables.
# Configuration for Redshift connection using environment variables
REDSHIFT_CONFIG = {
    'host': os.getenv('REDSHIFT_HOST'),
    'database': os.getenv('REDSHIFT_DATABASE'),
    'port': int(os.getenv('REDSHIFT_PORT')),
    'username': os.getenv('REDSHIFT_USER'),
    'password': os.getenv('REDSHIFT_PASSWORD')
}
Extract data from external files (CSV, XLSX, or JSON) with the load_data() function.
f1_path = os.path.join(base_dir, 'scatterPlotData.csv')
data_processor.load_data(data_source=f1_path, dataset_type='csv', dataset_name='scatter_plot')
2. Process data
Processing raw data often includes handling missing data, removing duplicate entries, and combining datasets. This step prepares the collected data for detailed analysis and visualization.
data_processor.preprocess_data('active_users', active_users_schema, not_null_col=['user_id'])
data_processor.basic_aggregation(
    dataset_name='active_users', timestamp_column_name='date',
    agg_column_name='user_id', agg_by=['nunique'], agg_period='weekly'
)
3. Generate visualizations
After cleaning and organizing the data, let’s do some visualization. The Visualizer class offers a variety of charts to choose from.
# Create visualization
visualizer = DataVisualizer(combined_datasets)

bar_chart_id = visualizer.generate_chart(
    dataset_name='active_users',
    chart_type='bar',
    x='period',
    y='active_users',
    title='Gridly Weekly Active Users',
    labels={'x': 'week', 'y': 'active_users'},
    custom_styles={'color': '#6CABDD'}
)
4. Generate report in source language
The ReportGenerator class will help us to compile the data into a comprehensive report in the source language.
Parameters for ReportGenerator:
- title: Name your report.
- author_name: Specify the report’s author.
- created_date: Records the date the report was generated.
- visualizer: Links to the visualizer object for incorporating dynamic visual content.
Steps to generate the report:
- Structure the report: Start by defining a title, author, and date.
- Insert visuals: Include visualizations that have been prepared earlier
- Add commentary: Provide insights and comments to accompany the visual data
report = ReportGenerator(
   report_title= f'Sample Report for Week {prev_week}',
   author_name='Han Nguyen - nhn@gridly.com',
   created_date=datetime.now().strftime('%Y-%m-%d'), visualizer=visualizer
 )
5. Translate reports using Gridly
Follow these 6 steps to configure Gridly for automatic translation of your reports:
- Set up your Gridly account
- Create a localization Grid
- Set up an Automation
- Extract text from original report
- Import text to Gridly and translate
5.1. Set up your Gridly account
If you are new to Gridly, sign up for a professional trial and create a project.
5.2. Create a localization Grid
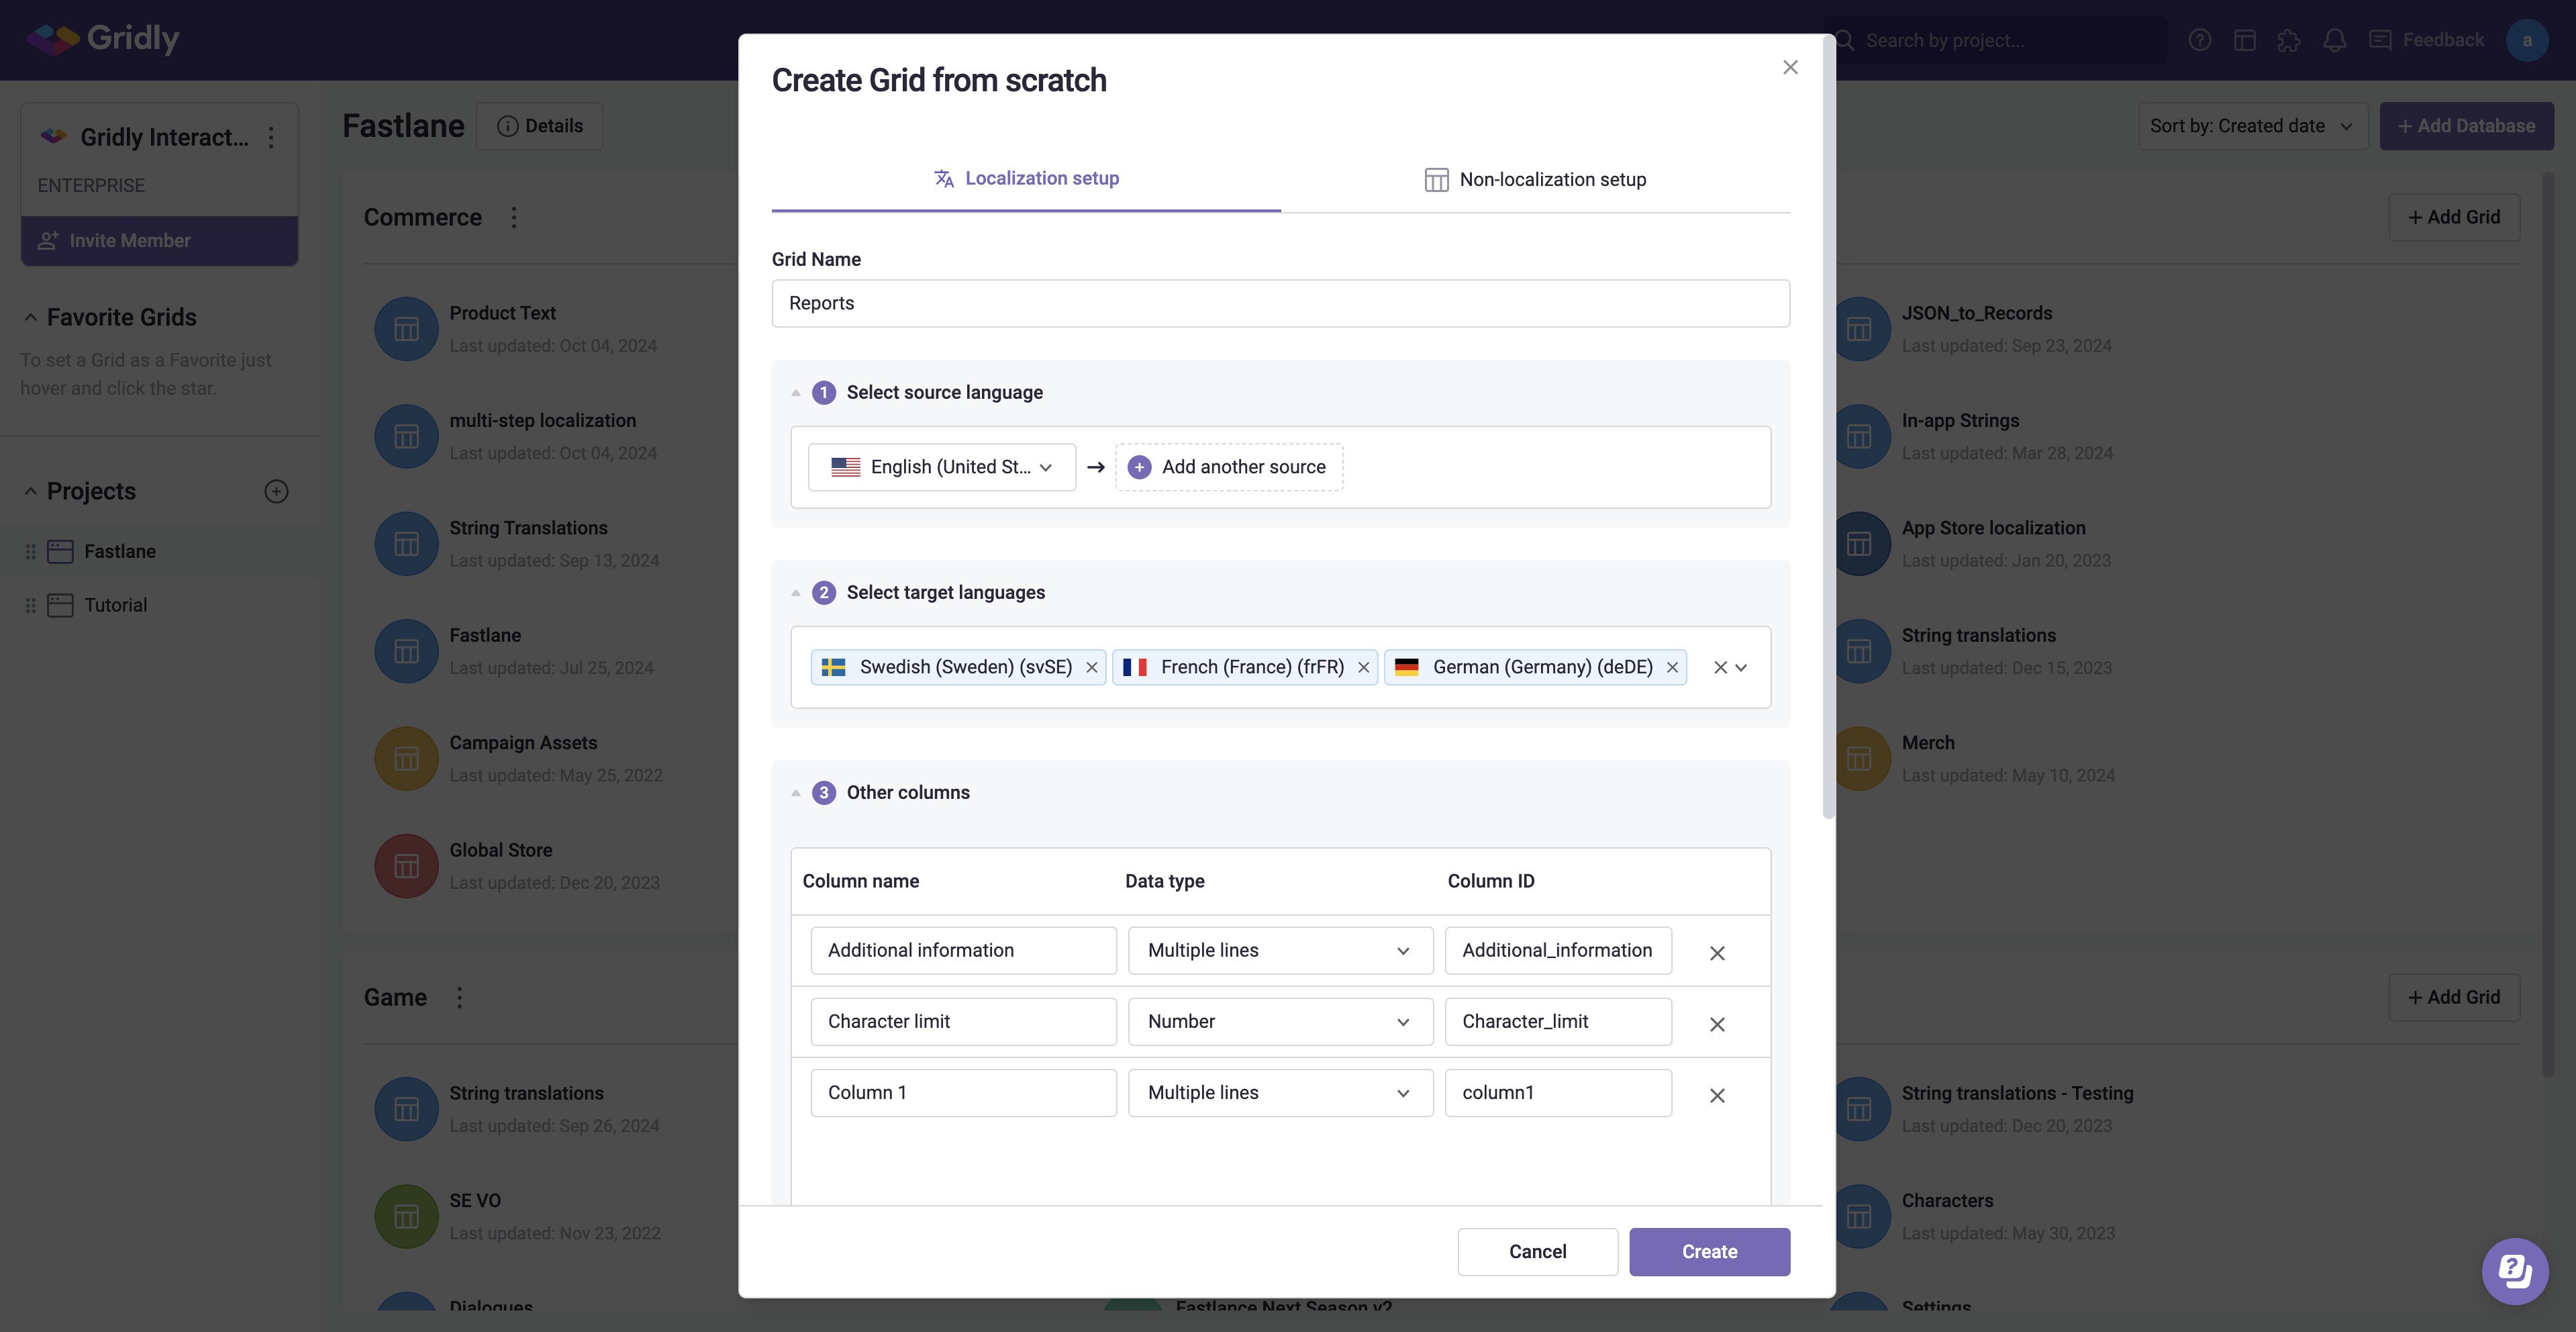
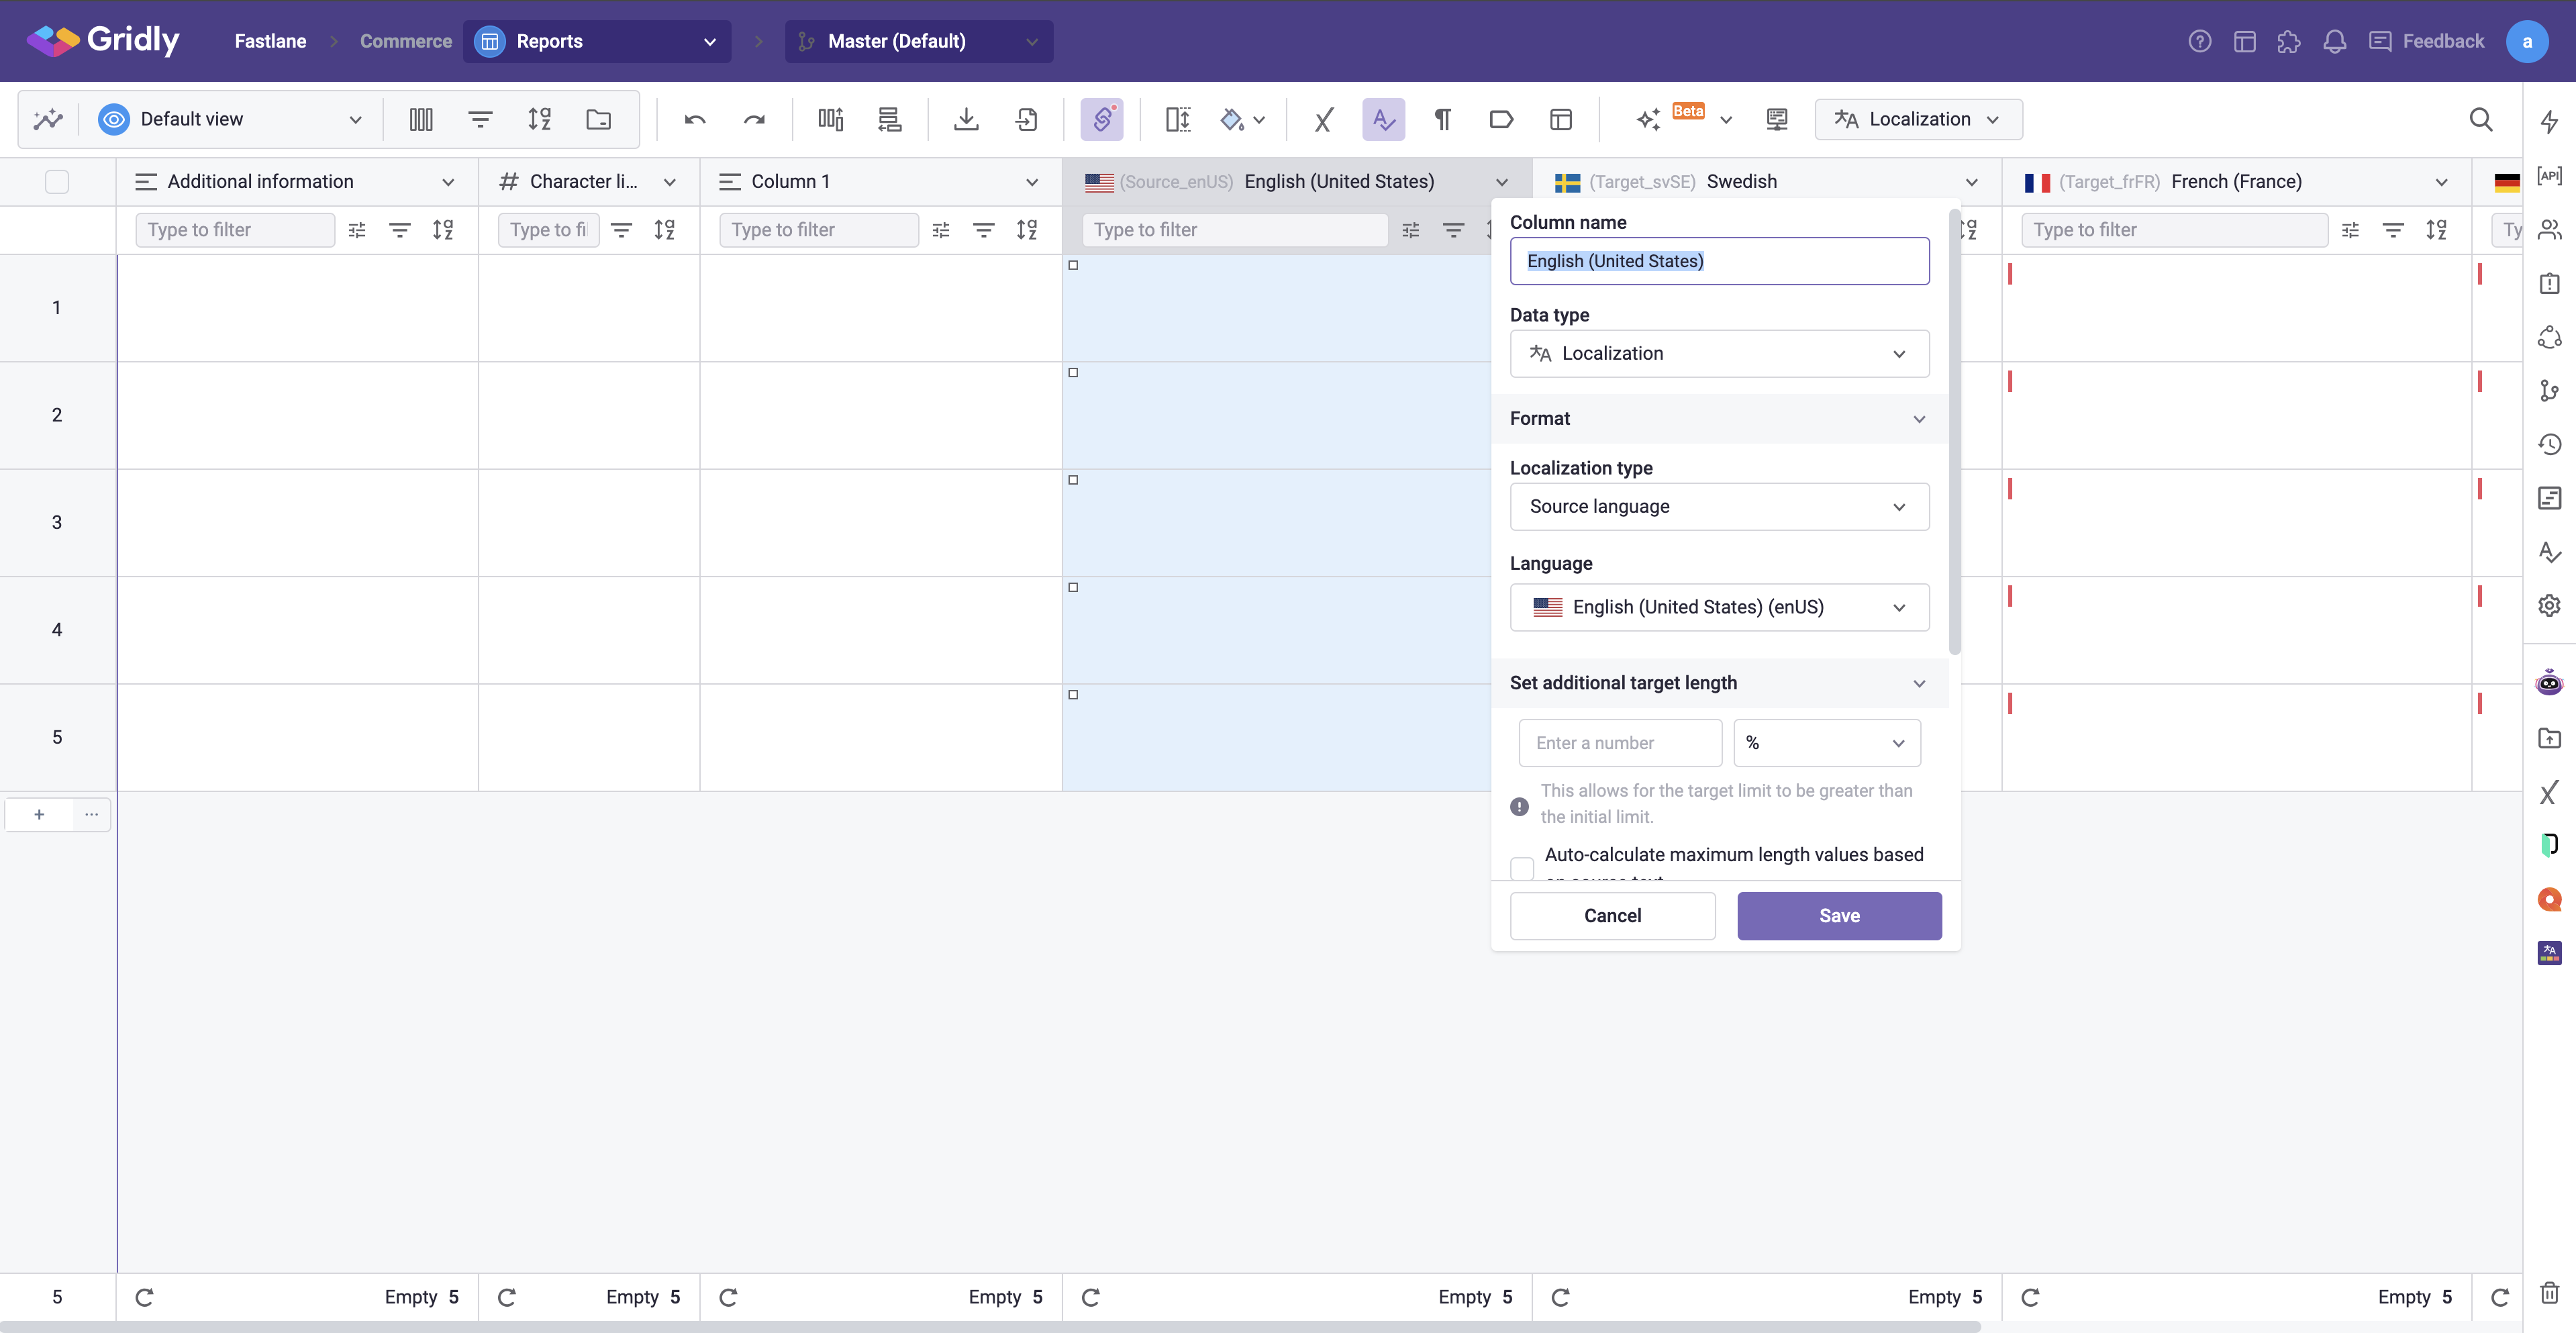
Set up a localization Grid within your project. Include the source language (the original language of your report) and target languages (languages you want to translate into).
idsource_languagetarget_language_1target_language_2- … (Add as many target languages as needed)

Create a Grid from scratch.

Grid created with source and target language columns.
5.3. Set up an Automation
Configure an automation flow in Gridly to use Google Text Translate for automatic translation when strings are added or updated in cells.
- Open the Automations tab in your Grid.
- Select Add Automation and give it a name.
- Select Add Trigger and choose the trigger events that will initiate the automation. In this case, we will go with Record updated. Set the trigger to watch the column with your source language.
- Select Add Step and choose Google Text Translate. Select source language, target language, and output column respectively. Repeat this step for each target language.
- Activate and test your automation to make sure it works.
5.4. Extract text from original report
The following Python script will extract all text elements from your report to a CSV file. We specify which elements to be selected (headings, paragraphs, table headers, and list items). Then, the extract() function retrieves the texts accordingly. Finally, the save_to_csv() function helps us save them to a file named extracted_text.csv.
# Define selectors for the HTML tags from which to extract text
selectors = {'tags': ['h1', 'h2', 'h3', 'h4', 'h5', 'h6', 'p', 'th', 'li']}
data, modified_html = extract(html_report, selectors=selectors, is_file=False)
save_to_csv(data, os.path.join(output_dir, 'extracted_text.csv'))
5.5. Import text to Gridly and translate
The code snippet below sets up parameters for proper column mapping, then imports your text to Gridly for translation.The column mapping ensures that the imported data is aligned correctly with columns in Gridly. I have also created the GridlyFeature class, which combines the Gridly API for easier usage. Replace view_id and API_key with your own.
import_request = {'withHeader': True, 'backup': False, 'columnMappings': [{'columnId': 'column1', 'fileColumnIndex':0}, {'columnId': 'column2', 'fileColumnIndex':1}]}
gridly_feature = GridlyFeature(view_id, API_key)
gridly_feature.import_file(os.path.join(output_dir, 'extracted_text.csv'), import_request)
The Gridly automation we have set up previously will be triggered to translate content into intended target languages. This is where Gridly excels over spreadsheet tools, significantly reducing efforts in managing translations across multiple languages.
Gridly can assist you further in maintaining the consistency of your translations. Since reports often contain repeating phrases, it is beneficial to store previously translated texts for reuse. Translation memory is the Gridly feature to help you achieve that by saving the translations of your most used words, phrases, even paragraphs to a database. Integrating this feature into your workflow improves overall consistency and ensures that translations are contextually correct. I encourage you to explore how to use Translation memory in Gridly and create a database that suits your reporting needs.
Once translation is completed, export the translated text from Gridly and integrate back into your reports.
print("Waiting for translations to complete...")
time.sleep(30)

   try:
       gridly_feature.export_file(os.path.join(output_dir, 'exported_text.csv'))
   except Exception as e:
       print(e)

source_html_path = os.path.join(output_dir, 'source_report.html')
translations_csv_path = os.path.join(output_dir, 'exported_text.csv')
target_languages = ['French', 'Swedish']

paths = create_translated_html_files(source_html_path, translations_csv_path, output_dir, target_languages)
6. Send reports to stakeholders
Time to send out your multi-language reports. For this example, we will send them to multiple Slack channels.
client = SlackClient()
files = {
    'channel_id_1': ['report1.html', 'report2.html'],  # Multiple reports to one channel
    'channel_id_2': ['report3.html']                  # Single report to another channel
}

for channel_id, file_paths in files.items():
    for path in file_paths:
        file_id = client.upload_file(channel_id, path)
Congratulations! You have successfully created a Python script to automate your reporting tasks. Host this project on a cloud platform and enjoy the efficiency it brings. Check out the full source code.
Conclusion
This article has suggested an approach to automating the generation and translation of Python multi-language reports using Gridly. While Python helps you work with data and create the initial report, Gridly assists in seamless and hands-off localization with features like Automation and Translation Memory. Of course, this Python script is yours to improve upon. Here are a few ways you might consider enhancing its capabilities:
- Include additional chart types or refine the design of existing tables.
- Bring in more data sources and target languages as your needs expand.
- Add your preferred communication channels, such as emails or other messaging apps.


